Other Resources
How to Draw Some Useful Charts Not on Excel Menus
The resources below show that one can use Excel for graphs that are not on its menus. However, it is easier to use software designed to draw these graphs if you know the necessary language. R, an implementation of the S language, is open source software that is extremely powerful and is available at no cost from http://www.r-project.org.
1 BOX PLOTS
A number of websites give instructions for drawing box plots using Excel but most do not include outliers. Therefore, I prefer the utility of Jon Peltier since it does handle outliers. Sites include:
2 DOT PLOTS
Here is a source that provides utilities to draw dot plots in Excel. Jon Peltier’s utility can handle more than one series. It is a valuable resource that is well worth the small cost.
3 MONTH PLOTS
The link below used to provide instructions for creating a month plot using Excel. (web page of D. Kelly O Day) It is no longer available. http://www.processtrends.com/pg_charts_monthly_cycle_chart.htm
4 ARROW PLOTS
Send an email to naomi@nbr-graphs.com for a macro to draw arrow charts using Excel 2003.
5 MULTIPANEL PLOTS
The following site provides a utility for creating multipanel charts in Excel:
6 SPARKLINES
 |
Edward Tufte introduced sparklines in his book Beautiful Evidence. Companies offering Excel add-ons to draw sparklines include BonaVista Systems and Bissantz. Sorry – another no longer available but newer versions of Excel offer sparklines. http://www.microcharts.net |
7 BULLET GRAPHS
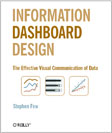 |
Bullet graphs are described in Information Dashboard Design by Stephen Few. Here are instructions for drawing bullet graphs as well as an inexpensive utility for drawing them: http://www.exceluser.com/catalog/landbullet1.htm |
OTHER USEFUL LINKS WHEN DRAWING GRAPHS
- For choosing colors go to http://www.colorbrewer2.org.
- A helpful utility to see how readers who have color vision deficiencies see the colors you used is available at http://www.vischeck.com.
- Choosing colors accessible to those with color vision deficiencies is included in Steven Gardner's master thesis, http://www.colorbrewer2.org. (click on updates on the top between how to use and credits and then scroll down to Section 3)
- Website of the Lighthouse, http://www.lighthouse.org/accessibility/effective-color-contrast/.
- An invaluable tool for matching colors is found at http://www.colorschemer.com/colorpix_info.php.
- Snagit available from TechSmith http://www.techsmith.com/ to capture the images you want to check with vischeck and for many other purposes.